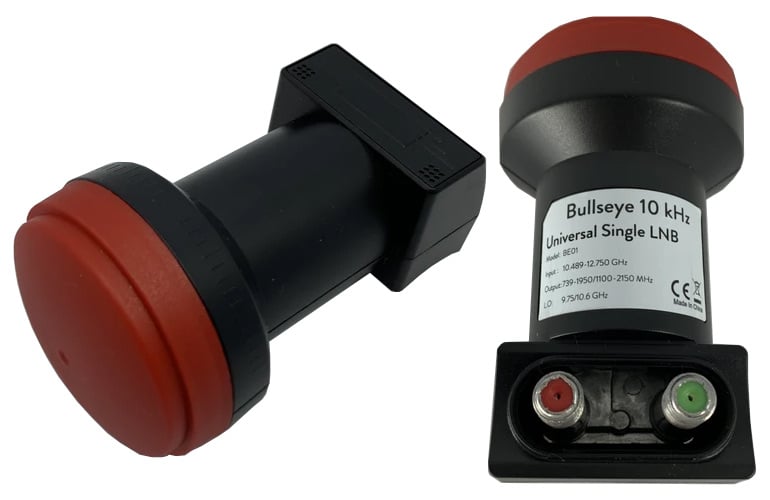
On September 15 we began our 33% off stock reduction sale for the Bullseye LNB. The Bullseye is an ultra stable LNB for receiving QO-100 and other Ku-Band satellites/applications. We'll be ending this sale on Wednesday, so if you'd like to purchase a unit please order soon to avoid missing out on the sale price. The current sale price is US$19.97 including free worldwide shipping to most countries.
To order the product, please go to our store, and scroll down until you see the QO-100 Bullseye TCXO LNB heading. Alternatively we also have stock via our Aliexpress storeor on eBay.
For more information about the Bullseye and some reviews please see the original sale post.
Back in June we posted about the release of Zbigniew Sztanga's NOAA-HIRS-Decoder which can decode HIRS instrument data which measures the vertical temperature profile of the Earth's surface. This HIRS signal is broadcast by NOAA satellites at the same time as their APT images and the HIRS frequency is close by at 137.350 MHz.
Recently Zbigniew has released a new decoder for the Microwave Humidity Sounder (MHS) instrument which is available on NOAA-19 only. This MHS instrument observes the Earth in the 89-190 GHz microwave band, which can be useful for measuring humidity levels. However, unlike the APT and HIRS signals which downlink data at around 137 MHz, the MHS data is broadcast in the L-band within the HRPT signal, so a motorized or tracked satellite dish will be required to receive it. Zbigniew writes:
The MHS (Microwave humidity sounder) is an instrument on NOAA-18 and NOAA-19. It replaced the older AMSU-B. It has a resolution of 90px per line and 5 channels.
Data from the instrument is present in HRPT and can be decoded with my new software. Unfortunately, only MHS on N-19 is working, because N-18's NHS is dead.
The instrument can be used to monitor low clouds, percipation and water vaopr in the atmosphere. I attached a sample image to the email.
Back in August we posted about the release of Sanchez, a tool originally designed to apply a color underlay image to grayscale infrared images received from geostationary weather satellites such as GOES 16/17, Himawari-8 and GK-2K. The tool has recently been updated with some very nice new features.
One of the new features is the ability to composite together images obtained from multiple satellites in order to form a full equirectangular image of the earth with live cloud cover. Another feature is the ability to use two or more images from different satellites to reproject back to geostationary projection at a specified longitude, essentially creating an image from a virtual satellite.
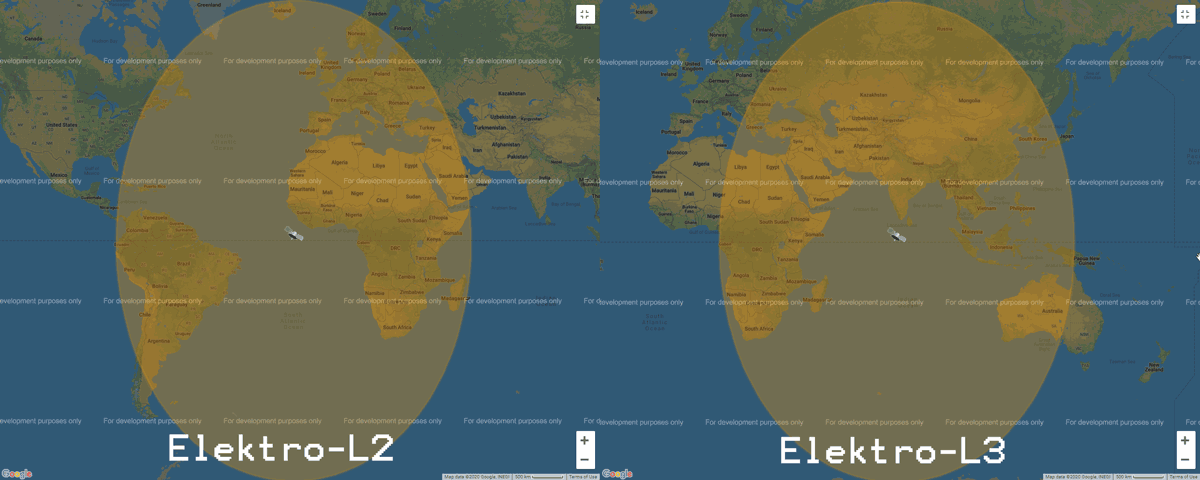
Elektro-L is a range of Russian geostationary weather satellites. Elektro-L1 and L2 were launched in 2011 and 2015 respectively, and Elektro-L3 was launched more recently in December 2019. Currently only Elektro-L2 and L3 are in operation. Like it's NOAA GOES, Himawari and GK-2A cousins, Elektro-L satellites beam back full disk images of the entire earth. Elektro-L2 is positioned to cover South America, Africa and Europe, whilst Elektro-L3 covers the East of Africa, Eastern Europe, Russia, Middle East, Asia and the West of Australia.
Elektro L2 and L3 Coverage from https://www.wmo-sat.info/
Recently @aang254 has been Tweeting that he has managed to get an Elektro-L decoder working. The decoder is open source and available on GitHub and Windows builds are already available. He notes that he's still working on the demodulator, but that should be released tomorrow. This decoder is great news as now Europeans now have an opportunity to receive full disk images. There is no full guide yet on how to use the decoder, but we expect that one will be released soon.
We note that according to wmo-sat.info the Elektro-L satellites transmit at ~1693 MHz, and have a 2 MHz wide HRIT and 200 kHz wide LRIT mode. So the signals should be able to be received with an RTL-SDR and appropriate LNA.EDIT: Unfortunately it seems that wmo-sat.info may have incorrect information, and that Elektro-L requires X-Band hardware to receive these images. While not totally impossible, an X-Band satellite SDR setup is a bit more difficult to put together compared to the L-band SDR setup used by GOES and GK-2A.
Published my ELEKTRO-L Decoder (early release)!
You can find it here under GPLv3, it takes synced derandomized CADUs as input, but I'll add in a demodulator tomorrow no worries!
Windows builds included already!https://t.co/Txh22PZ2cG
ELEKTRO-L 2 Decoding : Sucess! Here's a full disk pic!
Now cleaning up my decoders so they are usable by someone else... (And maybe also decode all channels to get RGB?) pic.twitter.com/X5c1YUyEOo
It may not be perfect on IR, but it works! Here are all 9 ELEKTRO-L channels (MSU-GS)!
I can upload full resolution images if someone is interested.
Decoder update published as well!https://t.co/Txh22PZ2cGpic.twitter.com/i3mFIT7alU
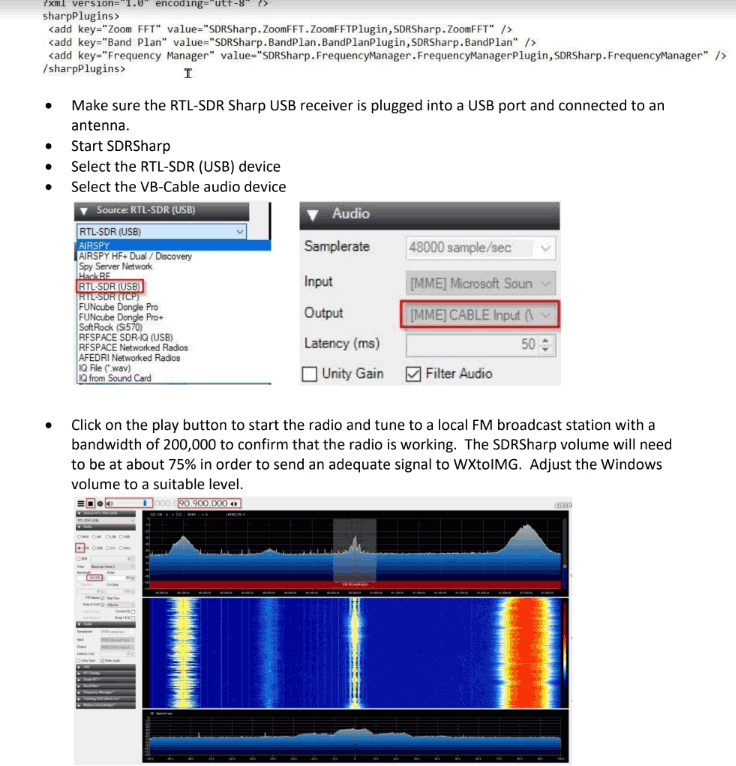
Thank you to John First for submitting his guide all about the setup and use of the software required to receive NOAA weather satellite images on Windows 10 (pdf file) with an RTL-SDR dongle. John's guide covers the use of SDR# for receiving the signal, WXtoIMG for decoding the signal, and Orbitron for tracking the satellite and automatically tuning SDR# when a satellite is in range.
He also explains the use of the VB-Audio Virtual Cable for piping audio between SDR# and WXtoIMG, as well as the DDE Tracking and Scheduling Plugin for interfacing SDR# with Orbitron, and finally how to do NTP clock synchronization to ensure the local time is accurate.
The institute for the Search for Extraterrestrial Intelligence (SETI) and GNU Radio are joining forces. SETI are an organization that uses radio telescopes to search for radio signals that may have been generated by extraterrestrial intelligence. As part of a transition from proprietary hardware to cheaper more capable off the shelf hardware such as USRP SDRs and GPU processors, SETI are beginning to make more use of the open source GNU Radio DSP processing suite. The use of GNU Radio will also allow other researchers and hobbyists at home to possibly help with their own analysis.
In the Zoom meeting below SETI and GNU Radio leaders discuss the partnership, also noting the importance RTL-SDRs have played in the advancement and popularisation of GNU Radio, as well in the general advancement of radio education.
Youssef the author of SDR# has recently released an update which adds a feature called "Sharp Slicer". This feature allows Airspy SDR users to open multiple instances of SDR#, each able to tune to a seperate signal within the currently tuned frequency range of the SDR. This is somewhat similar to the old multi-VFO plugin from rtl-sdr.ru, however the advantage of Slicer is that you can have seperate spectrum and waterfall graphs for each signal. This could be especially useful for monitoring multiple narrowband HF modes with an Airspy HF+ Discovery.
To use Sharp Slicer you must have an Airspy SDR, be it an Airspy Mini/R2 or HF+/Discovery. Unfortunately it will not work with RTL-SDR or other SDRs. Once the SDR is running in SDR#, simply press the "+" button on the top left to open a new Slicer instance. It seems possible to open as many instances as you want, and probably the only limitation is your CPU. On our Intel i7-6700 we tested up to 8 instances running at the maximum bandwidth of an Airspy Mini, and the SDR# CPU utilization was only at 50%.
A nice touch is that you can also see the location of each VFO on the master SDR# instance, and the color can be changed on each Slicer instance.
Awesome! SDR# Sharp Slicer.
The best day since the covid pandemic started. Multiple instances of SDR# running under a single Airspy device.
SDR# 17.42 + Airspy Discovery HF + Youloop inside the house.
I need a wider screen. pic.twitter.com/1mqDbZCgQe
Over on YouTube user mostlychris has uploaded a helpful tutorial video show how to use an RTL-SDR to collect data coming from a personal weather station and graph it on the home automation software known as Home Assistant.
To do this he uses an RTL-SDR on a Raspberry Pi running rtl_433 which receives and decodes the weather station data. He then configures rtl_433 to output data in the MQTT protocol which Home Assistant can receive and understand. Finally he configures Home Assistant to plot the received data. The tutorial is comprehensive covering every step required from start to finish.
Take charge of your own Ambient weather data with Raspberry Pi, MQTT, and Home Assistant.